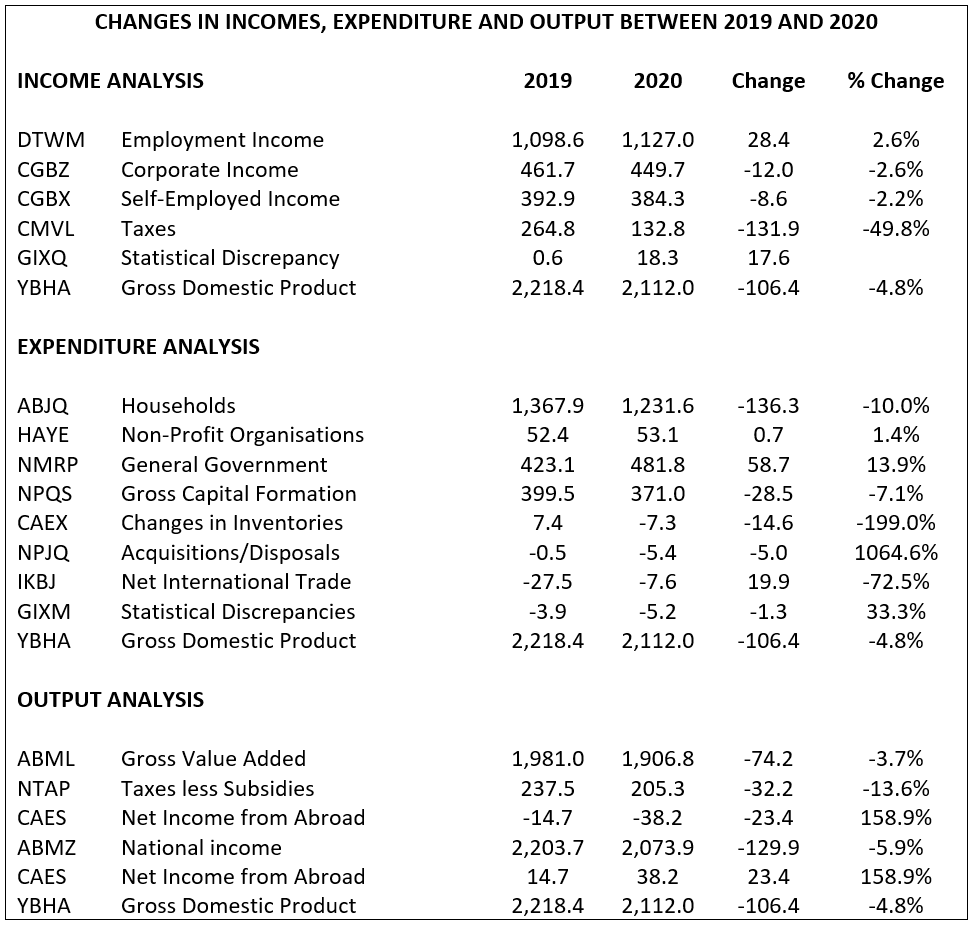
The Office for National Statistics has now produced comprehensive figures for the UK economy covering 2019 and 2020. The first table below shows the overall picture.

It shows how the UK economy has fared over the last two years measured in three different ways which, as a matter of accounting logic, all lead to the same total result. There was a fall in GDP between 2019 and 2020, which was actually comparatively small at 4.8%, excluding any account being taken of inflation which rose by 0.77% between 2019 and 2020. This reduces the GDP reduction in real terms to 4%.
From an income perspective, the 4.8% reduction came from a small increase – not a decrease – in employment income, hugely helped by the Government’s furlough scheme and small decreases in corporate and self-employment incomes, with the shortfall being largely absorbed by the Government, which saw its tax receipts falling by £131.9bn – almost half of the previous year’s total, and 6.2% of GDP.
On expenditure, the biggest change was a £136.3bn drop in household spending – 6.5% of GDP – nearly the same figure as the fall in government tax receipts. Effectively, room was made for the fall in government tax revenue – and the increase in government borrowing which this entailed – by increased household saving. This avoided the economy becoming overtaxed by large scale unfunded government expenditure, which rose by £58.7bn (13.9%). Capital formation fell by £28.5bn (5.1% on the previous total) while there was a 72.5% drop of £19.9bn in our trade deficit.
On output, gross value added fell by £74.2bn – 3.5% of GDP – an important measure of the total output of the economy before taxes and subsidies are taken into account. In 2020, our national income was £32.2bn less than our GDP as a result of our negative net income from abroad of this amount. 
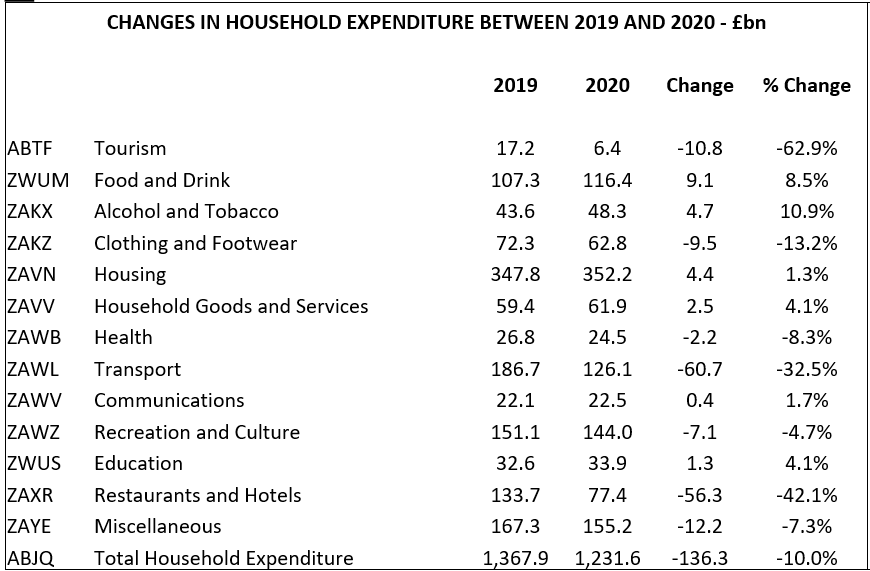
The second table shows a detailed breakdown of household expenditure, to see how the total decrease in spending of £136.3bn was achieved. Not surprisingly, the two big reductions were on transport – £60.7bn, a fall of 32.5% – and restaurants and hotels, where spending dropped by £56.3bn – 42.1%.
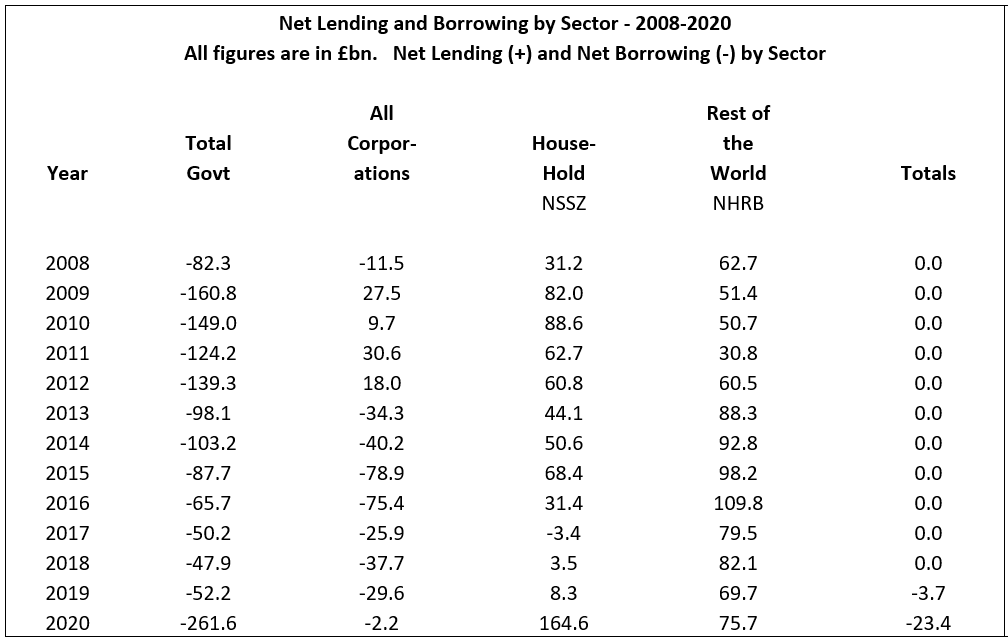
The third table shows borrowing and lending by sector. Again, as an accounting identity, all surpluses have to be exactly matched by deficits somewhere else and total borrowing has to equal total lending. This is why all the figures, when fully reconciled by ONS, have to sum to zero. At the moment, there is still a difference of £23.4bn. According to the current data, total government borrowing rose by £209.4bn to £261.6bn between 2019 and 2020.
The hugely increased 2020 government borrowing total was financed by an enormous rise in household saving, which increased by £156.3bn between 2019 and 2020, i.e. by 7.4% of GDP. This new saving was buttressed by a continuing large volume of borrowing from abroad – £75.7bn in 2020.
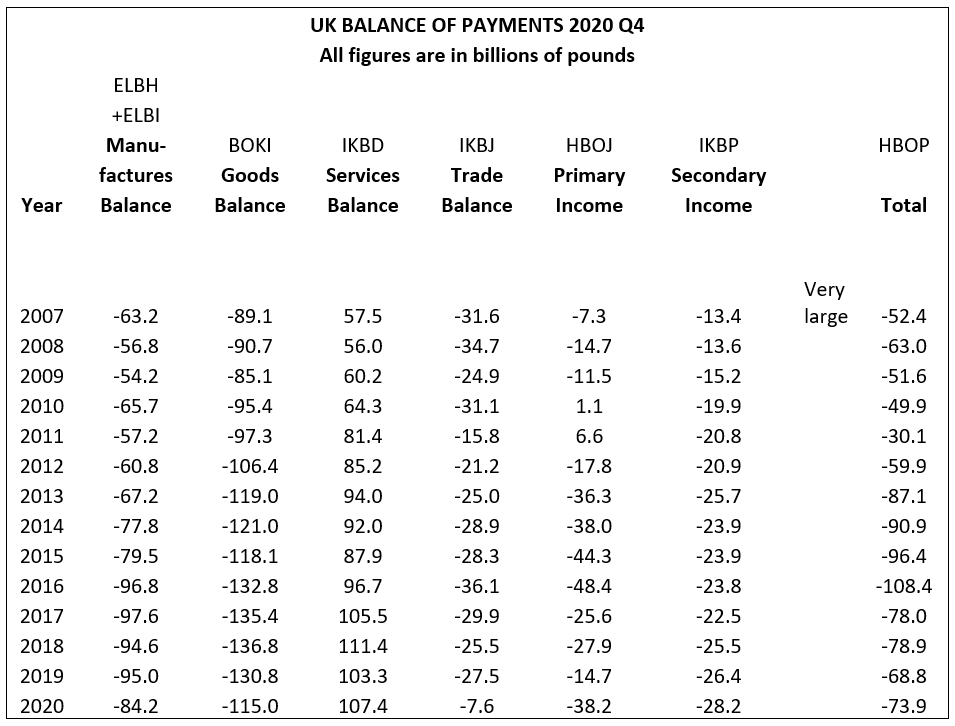
The final table shows what has happened to our balance of balance of payments over the last two years. Our deficit on goods fell by £15.8bn, with £10.8bn of this figure being accounted for by an improving balance on manufactured goods, no doubt partly reflecting higher saving and lower retail sales. Our trade surplus on services increased by £4.1bn, resulting in our trade deficit falling between 2019 and 2020 by £19.9bn to £7.6bn. Despite this improvement in our trading performance, deteriorating net income from abroad and a continuing rise in our transfer payments overseas led to a total balance of payments deficit of £73.9bn in 2020 – broadly in line with previous outcomes.
Are there any conclusions about the future which can be drawn from these figures? Caution is required in these uncertain times, but the following inferences may turn out to be valid:
1. GDP will tend to rise in 2021 as expenditure on travel and hospitality increases but stimulus from these sources will be offset by reduced incomes as the furlough scheme is wound down. Growth in 2021 may not therefore be that high.
2. Household saving will very probably come down as restrictions are lifted, increasing the pressure on resources, potentially leading to both a rise in inflation and a worsening of our balance of payments.
3. Government borrowing will fall in 2021 but probably not to anything close to the £52.2bn seen in 2019. If there is a permanent shift to higher household savings, to avoid this change having a deflationary impact, government deficit spending and borrowing will have to remain relatively high.
